Post-processing & diagnostics
Source:vignettes/articles/a07_post_processing.Rmd
a07_post_processing.RmdDiagnostics
Use markdown templates to create a customised set of diagnostics to reuse on multiple models. In the demo an example is shown in Scripts/basic_gof.Rmd, but ideally you’ll create your own customised version with everything you need to evaluate your model. To create an R markdown diagnostic template go to FILE -> New File -> R markdown -> From Template then select from one of the following:
model diagnosticVPC diagnosticPPC diagnosticbootstrap results
PLACEHOLDER: short YouTube video of opening, customising, saving and running a template.
A template will appear in the script window for you to customise. Instructions are the at the top. Save the file (e.g. as Scripts/basic_gof.Rmd) and run in your log script with:
It will create the output in Results (or results_dir(m1))
Apply a fully editable goodness of fit R markdown template to both runs m2 and m3:
Note: c(m1, m3) is a vector object of 2 NONMEM runs. We’ll touch more on this later.
Evaluate and compare runs on the fly with the following commands
rr(c(m2, m2WT))
#>       parameter     type unit trans   FIX     Models/m2       Models/m2WT
#> 1            KA    THETA  h-1   LOG FALSE   1.5 (21.6%)       1.5 (21.6%)
#> 2            CL    THETA  h-1   LOG FALSE  0.04 (8.33%)    0.0398 (7.84%)
#> 3             V    THETA    L   LOG FALSE 0.461 (4.65%)     0.459 (4.66%)
#> 11 TVCLWTlinear    THETA       <NA> FALSE          <NA> -0.0115 (0.00875)
#> 4        IIV_KA OMEGAVAR  CV%   LOG FALSE  80.3 (21.2%)      80.7 (22.7%)
#> 5        IIV_CL OMEGAVAR  CV%   LOG FALSE  28.2 (27.9%)      26.1 (35.5%)
#> 6         IIV_V OMEGAVAR  CV%   LOG FALSE    13 (44.8%)        13 (45.2%)
#> 7    prop error    SIGMA   SD  <NA> FALSE 0.141 (10.3%)     0.134 (12.1%)
#> 8     add error    SIGMA   SD  <NA> FALSE   0.229 (20%)     0.264 (25.8%)
#> 9           OBJ      OBJ       <NA>    NA        104.81           102.714
#> 10      CONDNUM  CONDNUM       <NA>    NA         6.478             7.956
plot_iter(m2, skip = 10) ## skip first 10 interations
#> Joining, by = "variable"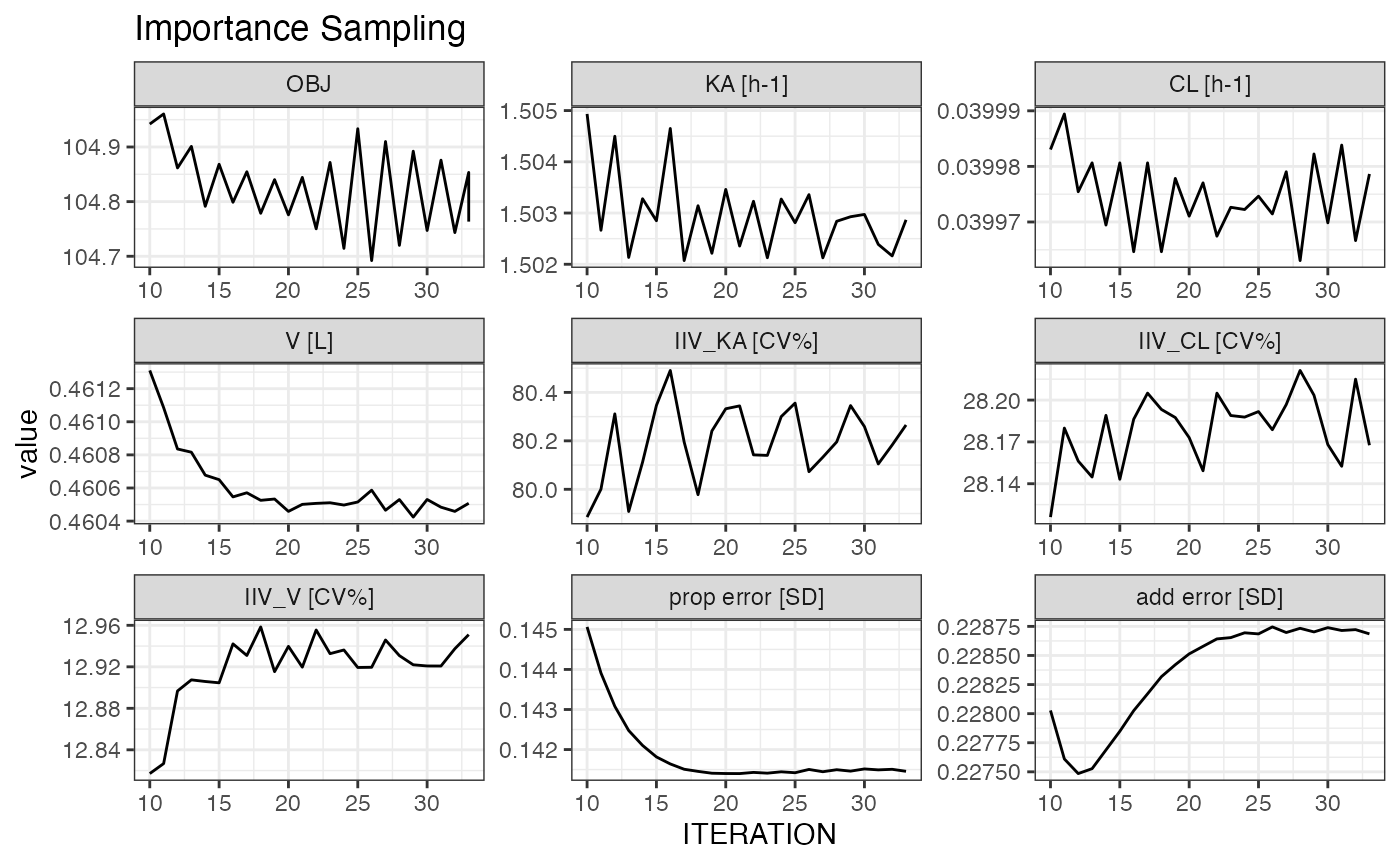
covariance_plot(m2)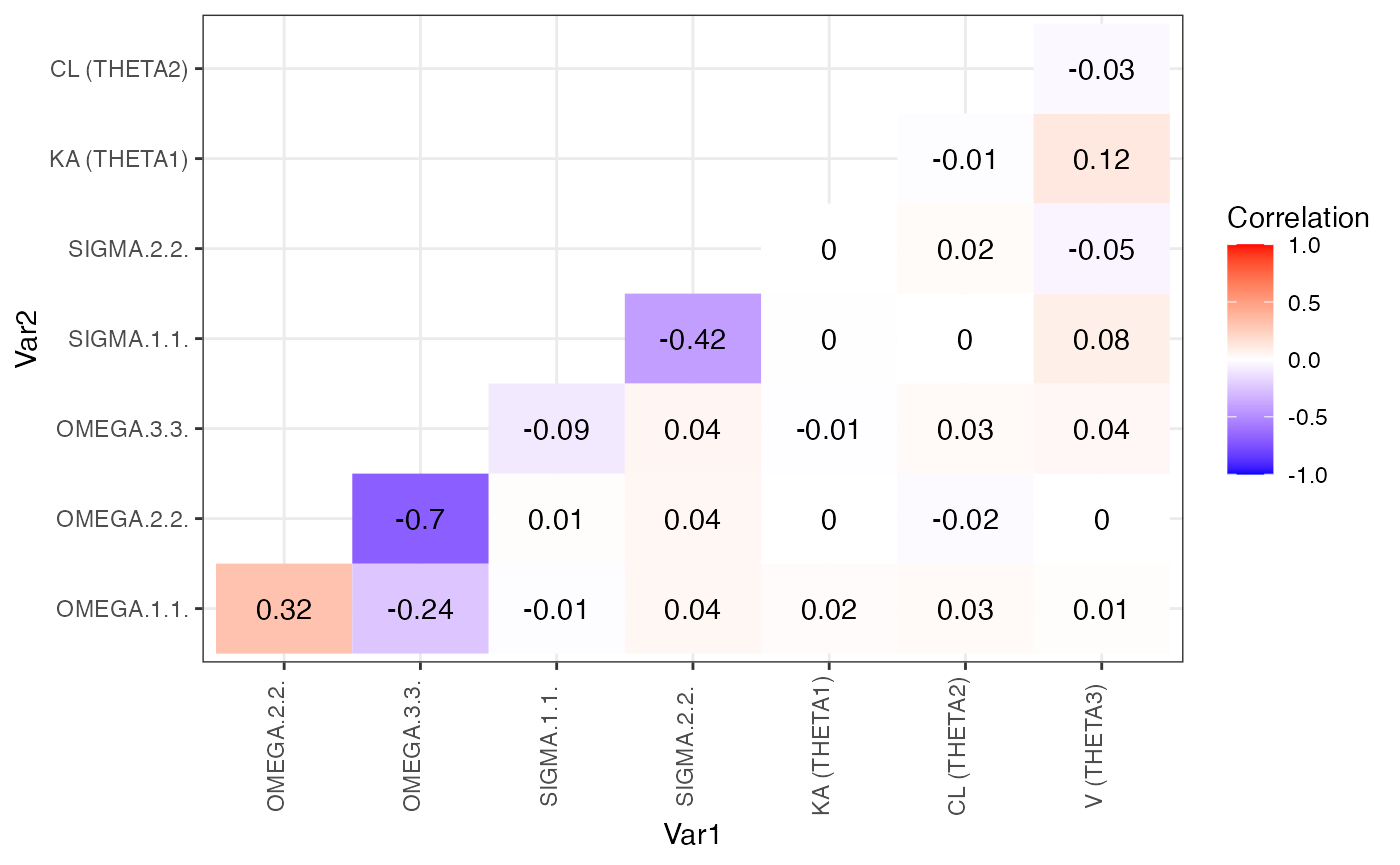
However these are better placed inside templates to enable rapid and consistent re-use.
Simulation based diagnostics
Create simulation based diagnostics first by running a simulation using update_parameters() and convert_to_simulation(). Then use the ppc diagnostics and vpc diagnostics R markdown templates to generate customisable VPC and PPC diagnostics reports.
m2s <- m2 %>% child(run_id = "m2s") %>%
              update_parameters(m2) %>%
              convert_to_simulation(subpr = 50) %>%
              run_nm()

m2s %>% nm_render("Scripts/basic_vpc.Rmd")
m2s %>% nm_render("Scripts/basic_ppc.Rmd")PPC diagnostics
The ppc diagnostics R markdown templates use the NMproject functions to allow easy creation of VPCs.
The example code contains two functions, idEXPstat for computing exposure statistics from raw data, and EXPstat for computing summaries (median and CV%) of exposure statistics. These will be applied to both the raw data and simulated datasets to
#> written:
#> DerivedData/data.RDS
#> DerivedData/data.csv
idEXPstat <- function(d, ...){ ## example statistic function
  ## arg = nonmem dataset data.frame
  ## return data.frame with statistic column
  d %>% group_by(ID, ...) %>% filter(is.na(AMT)) %>%
    summarise(
      AUC = AUC(time = TIME, conc = DV),
      CMAX = max(DV, na.rm = TRUE),
      TMAX = TIME[which.max(DV)]
    ) %>%
    tidyr::gather(key = "exposure", value = "statistic", AUC:TMAX) %>%
    ungroup()
  ## must return a dataset that summarises longitudinal dataset into one per ID, and must contain a "statistic" column
}

EXPstat <- function(d, ...){ ## example statistic function
  ## arg = nonmem dataset data.frame
  ## return data.frame with statistic column
  d %>% idEXPstat(...) %>%  ## reuse idEXPstat for individual stats
    ## summarise over study and any other variables (...)
    group_by(exposure, ...) %>%
    summarise(
      median = median(statistic, na.rm = TRUE),
      cv = 100*sd(statistic, na.rm = TRUE)/mean(statistic, na.rm = TRUE)
    ) %>%
    tidyr::gather(key = "type", value = "statistic", median:cv)
  ## must return a dataset that summarises longitudinal dataset into one per "cohort", and must contain a "statistic" column
}
## here msim is nm vector of simulation control files
ppc_data0 <- msim %>% ppc_data(EXPstat)

ppc_data0 %>%
  filter(type %in% "median") %>%
  mutate(exposure = paste(type, exposure, sep = "_")) %>%
  ppc_histogram_plot(exposure)

ppc_data0 %>%
  filter(type %in% "cv") %>%
  mutate(exposure = paste(type, exposure, sep = "_")) %>%
  ppc_histogram_plot(exposure)
We can conclude that the model predicts median exposure and variability of exposure well. The remaining plots show stratified versions of these.
Bootstraps
The package rsample can be used to create bootstrap datasets in your initial data manipulation scripts. The following is an example bootstrap dataset being prepared with stratification on SEX and bodyweight WTC categorised in two categories
d <- d %>%
  mutate(WT_C = cut(WT, breaks = 2, labels = FALSE),
         STRATA = paste(SEX, WT_C, sep = "_"))

d_id <- d %>% distinct(ID, STRATA)

set.seed(123)

## create large set of resamples (to enable simulation to grow without ruining seed)
bootsplits <- rsample::bootstraps(d_id, 100, strata = "STRATA")

dir.create("DerivedData", showWarnings = FALSE)
bootsplits %>% saveRDS("DerivedData/bootsplit_data.csv.RData")
In a model development script, the following, performs a 100 sample bootstrap of model m1
m1_boot <- m1 %>% make_boot_datasets(samples = 100, overwrite = TRUE)

m1_boot$m %>% run_nm()

## the following bootstrap template will wait for results to complete
m1_boot$m %>% nm_list_render("Scripts/basic_boot.Rmd")
Results can be viewed in Results/basic_boot.m1.html.